
News
Arctic Sea Ice in Focus: New Map Shows Winter Conditions for February 2026
A new map published on Arctic Portal highlights the Arctic sea-ice extent for February 2026, offering an up-to-date snapshot of winter ice conditions across the Arctic Ocean.
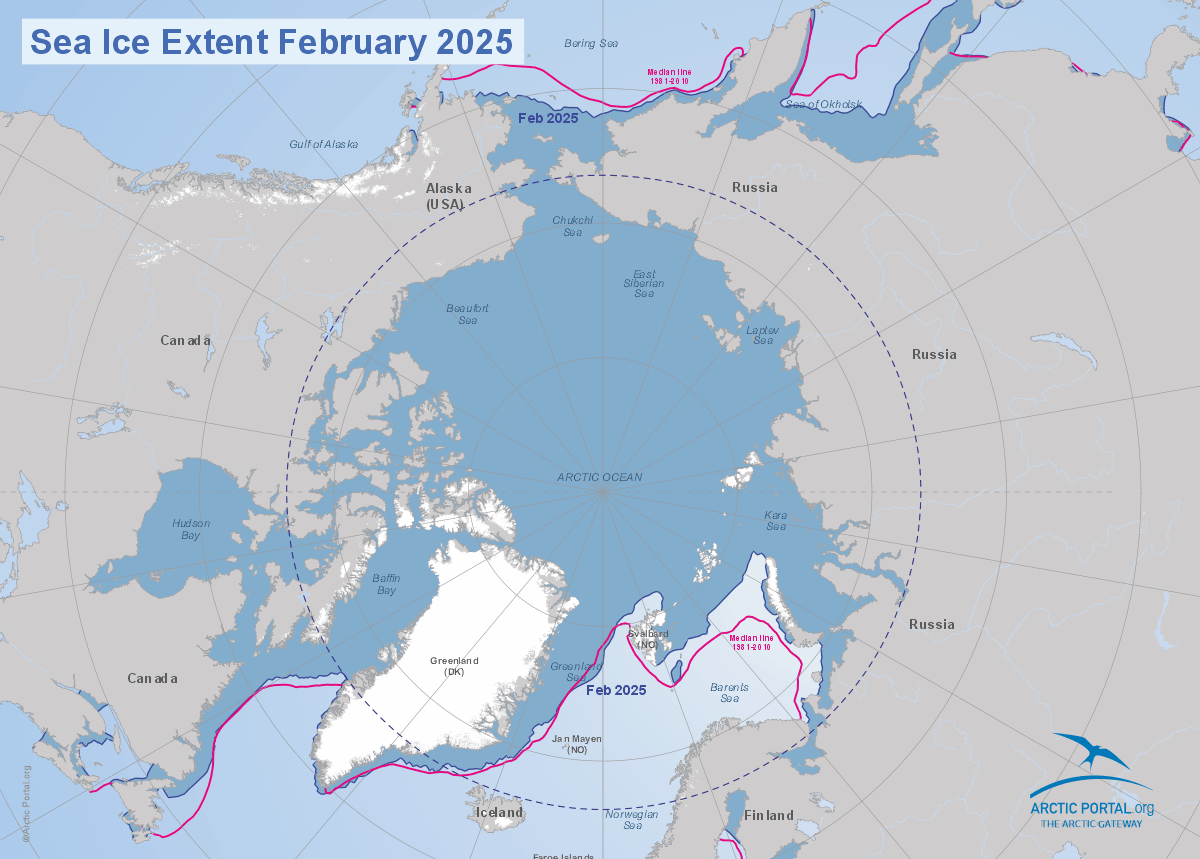
The map, based on satellite observations from the National Snow and Ice Data Center (NSIDC) at the University of Colorado Boulder, visualizes the distribution and concentration of sea ice at a time of year when Arctic ice is typically near its seasonal maximum.
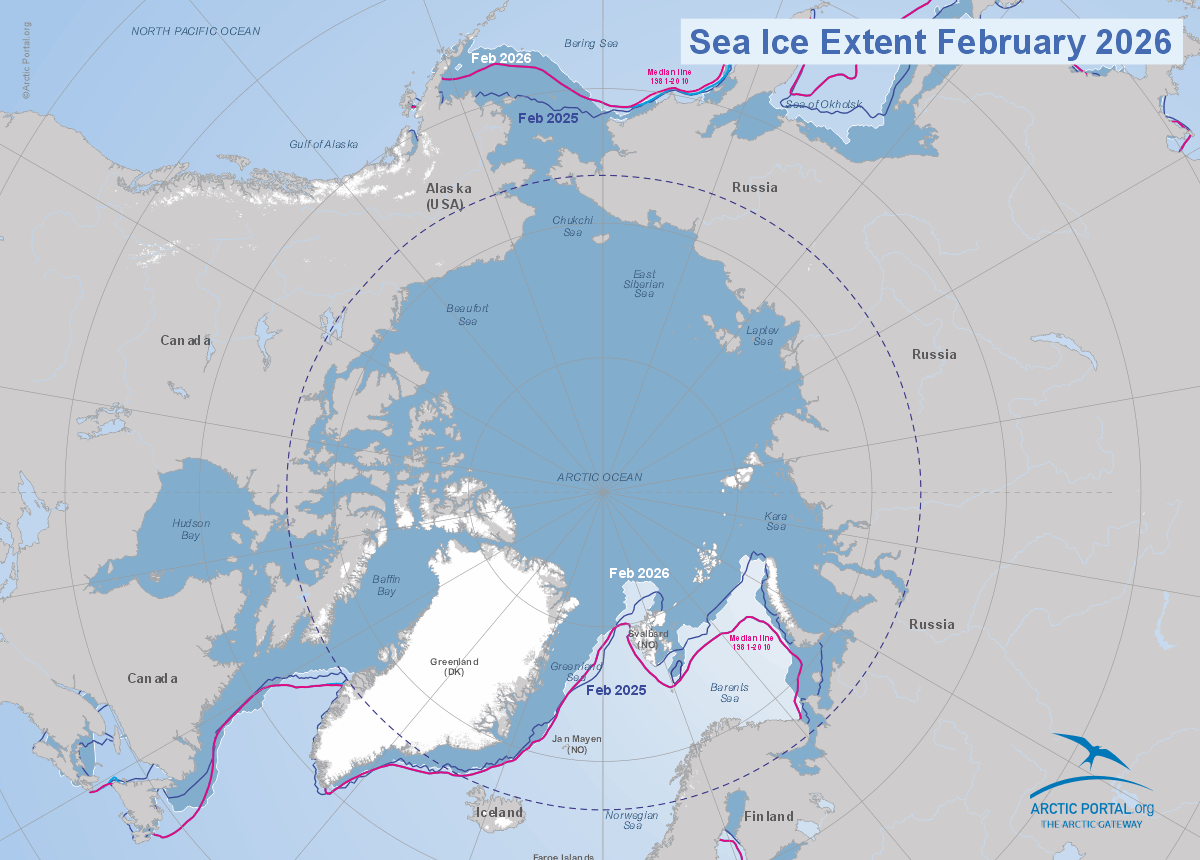
Alongside the new visualization, Arctic Portal has also released a comparison page showing sea-ice conditions in February 2025 and February 2026, allowing viewers to explore year-to-year differences in Arctic ice coverage.
See more comparisons in our Map Gallery
A critical moment in the Arctic sea-ice cycle
Each year, Arctic sea ice follows a natural seasonal cycle. Ice grows during the dark winter months and typically reaches its maximum extent between late February and March, before melting through spring and summer toward a minimum in September.
February is therefore a key period for scientists monitoring the Arctic. It provides a clear indication of how the winter ice season is developing and offers insight into how much ice may remain later in the year.
Comparing February 2025 and February 2026
The new Arctic Portal comparison map illustrates differences in sea-ice coverage between February 2025 and February 2026. Such comparisons are essential for understanding short-term variability within a longer-term trend of declining Arctic sea ice.
Satellite observations from the National Snow and Ice Data Center (NSIDC) show notable differences between the two years. The average Arctic sea-ice extent in February 2025was about 13.75 million square kilometres, making it the lowest February extentrecorded in the satellite record that began in 1979. This value was roughly 220,000 km² lower than the previous February record low set in 2018, highlighting the unusually weak winter ice growth that year. Scientists also noted that sea-ice expansion stalled twice during February 2025, contributing to below-average ice coverage across parts of the Arctic, particularly in the Barents Sea.
By comparison, Arctic sea ice during February 2026 grew from around 13.6 million km² at the beginning of the month to about 14.1 million km² by early March, as winter ice continued expanding toward the seasonal maximum. While this indicates slightly greater ice coverage than in February 2025, the values remain well below historical averages, demonstrating how year-to-year variability occurs within a broader long-term decline in Arctic sea-ice extent.
Why Arctic sea ice matters
Sea ice plays a critical role in the global climate system. The bright, reflective surface of ice helps bounce sunlight back into space, while open ocean absorbs more heat. When sea ice declines, more heat is retained in the ocean, which can further accelerate warming, a process known as the ice-albedo feedback.
The Arctic is warming several times faster than the global average, making sea ice one of the most visible indicators of climate change in the region.
Changes in sea ice also influence:
- Arctic ecosystems and wildlife, including polar bears and seals
- Marine transportation routes and fisheries
- Coastal communities and infrastructure
- Global weather patterns through impacts on atmospheric circulation
Because of these wide-ranging effects, scientists often refer to sea-ice monitoring as an “early warning system” for climate change.
Mapping the changing Arctic
Satellite observations collected by organizations such as NSIDC allow researchers to track sea-ice extent, concentration, and seasonal changes across the Arctic Ocean. These datasets form the basis for many maps and visualizations that help scientists, policymakers, and the public understand the evolving Arctic environment.
Over the longer term, NSIDC records show that February Arctic sea ice has declined by roughly 2–3% per decade since 1979, reflecting the rapid warming occurring in the Arctic. This persistent downward trend underscores how the region is changing faster than most other parts of the planet.
By publishing updated maps and year-to-year comparisons, Arctic Portal contributes to the effort to make Arctic climate data accessible and understandable.
The February 2026 sea-ice map and comparison tools provide a visual reminder that the Arctic remains a region of rapid environmental change, where careful monitoring and open data are essential to understanding what lies ahead.
Source: NSIDC
The tags below provide an opportunity to view previously posted related news within the selected category